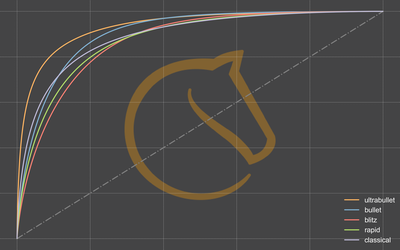
extract from Figure 2
Exploring how Lichess' players spend their playing time, Part 1 of 2
While my original intention was to gather data on Chess addiction, it has evolved into a broader investigation into how players typically spend their time on Lichess.The data was aggregated from the January 2023 Lichess rated games (freely available on the Lichess database website). Bots and games shorter than 4 plies were filtered out. For each account (which from now on I will consider equivalent to a user), I kept their username, as well as for each time control (TC for short, also sometimes referred as category):
- Their number of games
- Their average rating over the month
- The "Estimated time spent", which is the total time they spent playing this TC, with each game duration computed only using the clocks configuration, using Lichess' formula to differenciate between blitz/bullet/etc: (clock initial time in seconds) + 40 × (clock increment).
- The "Real time spent", which is the total time they spent playing this TC, based on the time left on the clock at the end of the game, and taking into account increment and berserk. Apart from obvious cases, it does not take into account the use of the
+15sbutton, which was considered negligible.
Here is an extract from the data for the bullet category.
| username | games | avg_rating | approximate_time | real_time | |
|---|---|---|---|---|---|
| 0 | ange_de_la_mode | 85 | 1430 | 0 days 01:32:20 | 0 days 02:26:59 |
| 5 | Ankit_khandelwal_07 | 214 | 1316 | 0 days 03:39:00 | 0 days 05:33:30 |
| 8 | jpn26 | 550 | 1577 | 0 days 09:10:00 | 0 days 14:07:11 |
| 10 | ptitbill | 303 | 1465 | 0 days 13:28:00 | 0 days 20:37:07 |
| 17 | Inkety | 31 | 1467 | 0 days 00:31:00 | 0 days 00:42:31 |
They were 2,073,933 2,073,569 (removing bots) distinct users who played that month.
How is time spent playing distributed by time control?
In order to get an initial overview of the dataset, I wanted to see the most popular time controls in terms of players, games and time spent.

Figure 1
As expected the number of games alone is not a good appreciation of how much total time is spent playing.
On the other hand, we can observe that the estimated time formula is fairly accurate for all but the classical category, where the total estimated time played is much higher than real time spent.
In which time control do individual players spend the most time?
The previous figure only gives a rough overview of the time spent per time control. We want to compare the average/median time spent by players in each time controls to get more information. A boxplot is a nice graphical representation to synthetically summarizes characteristics of the time spent data.
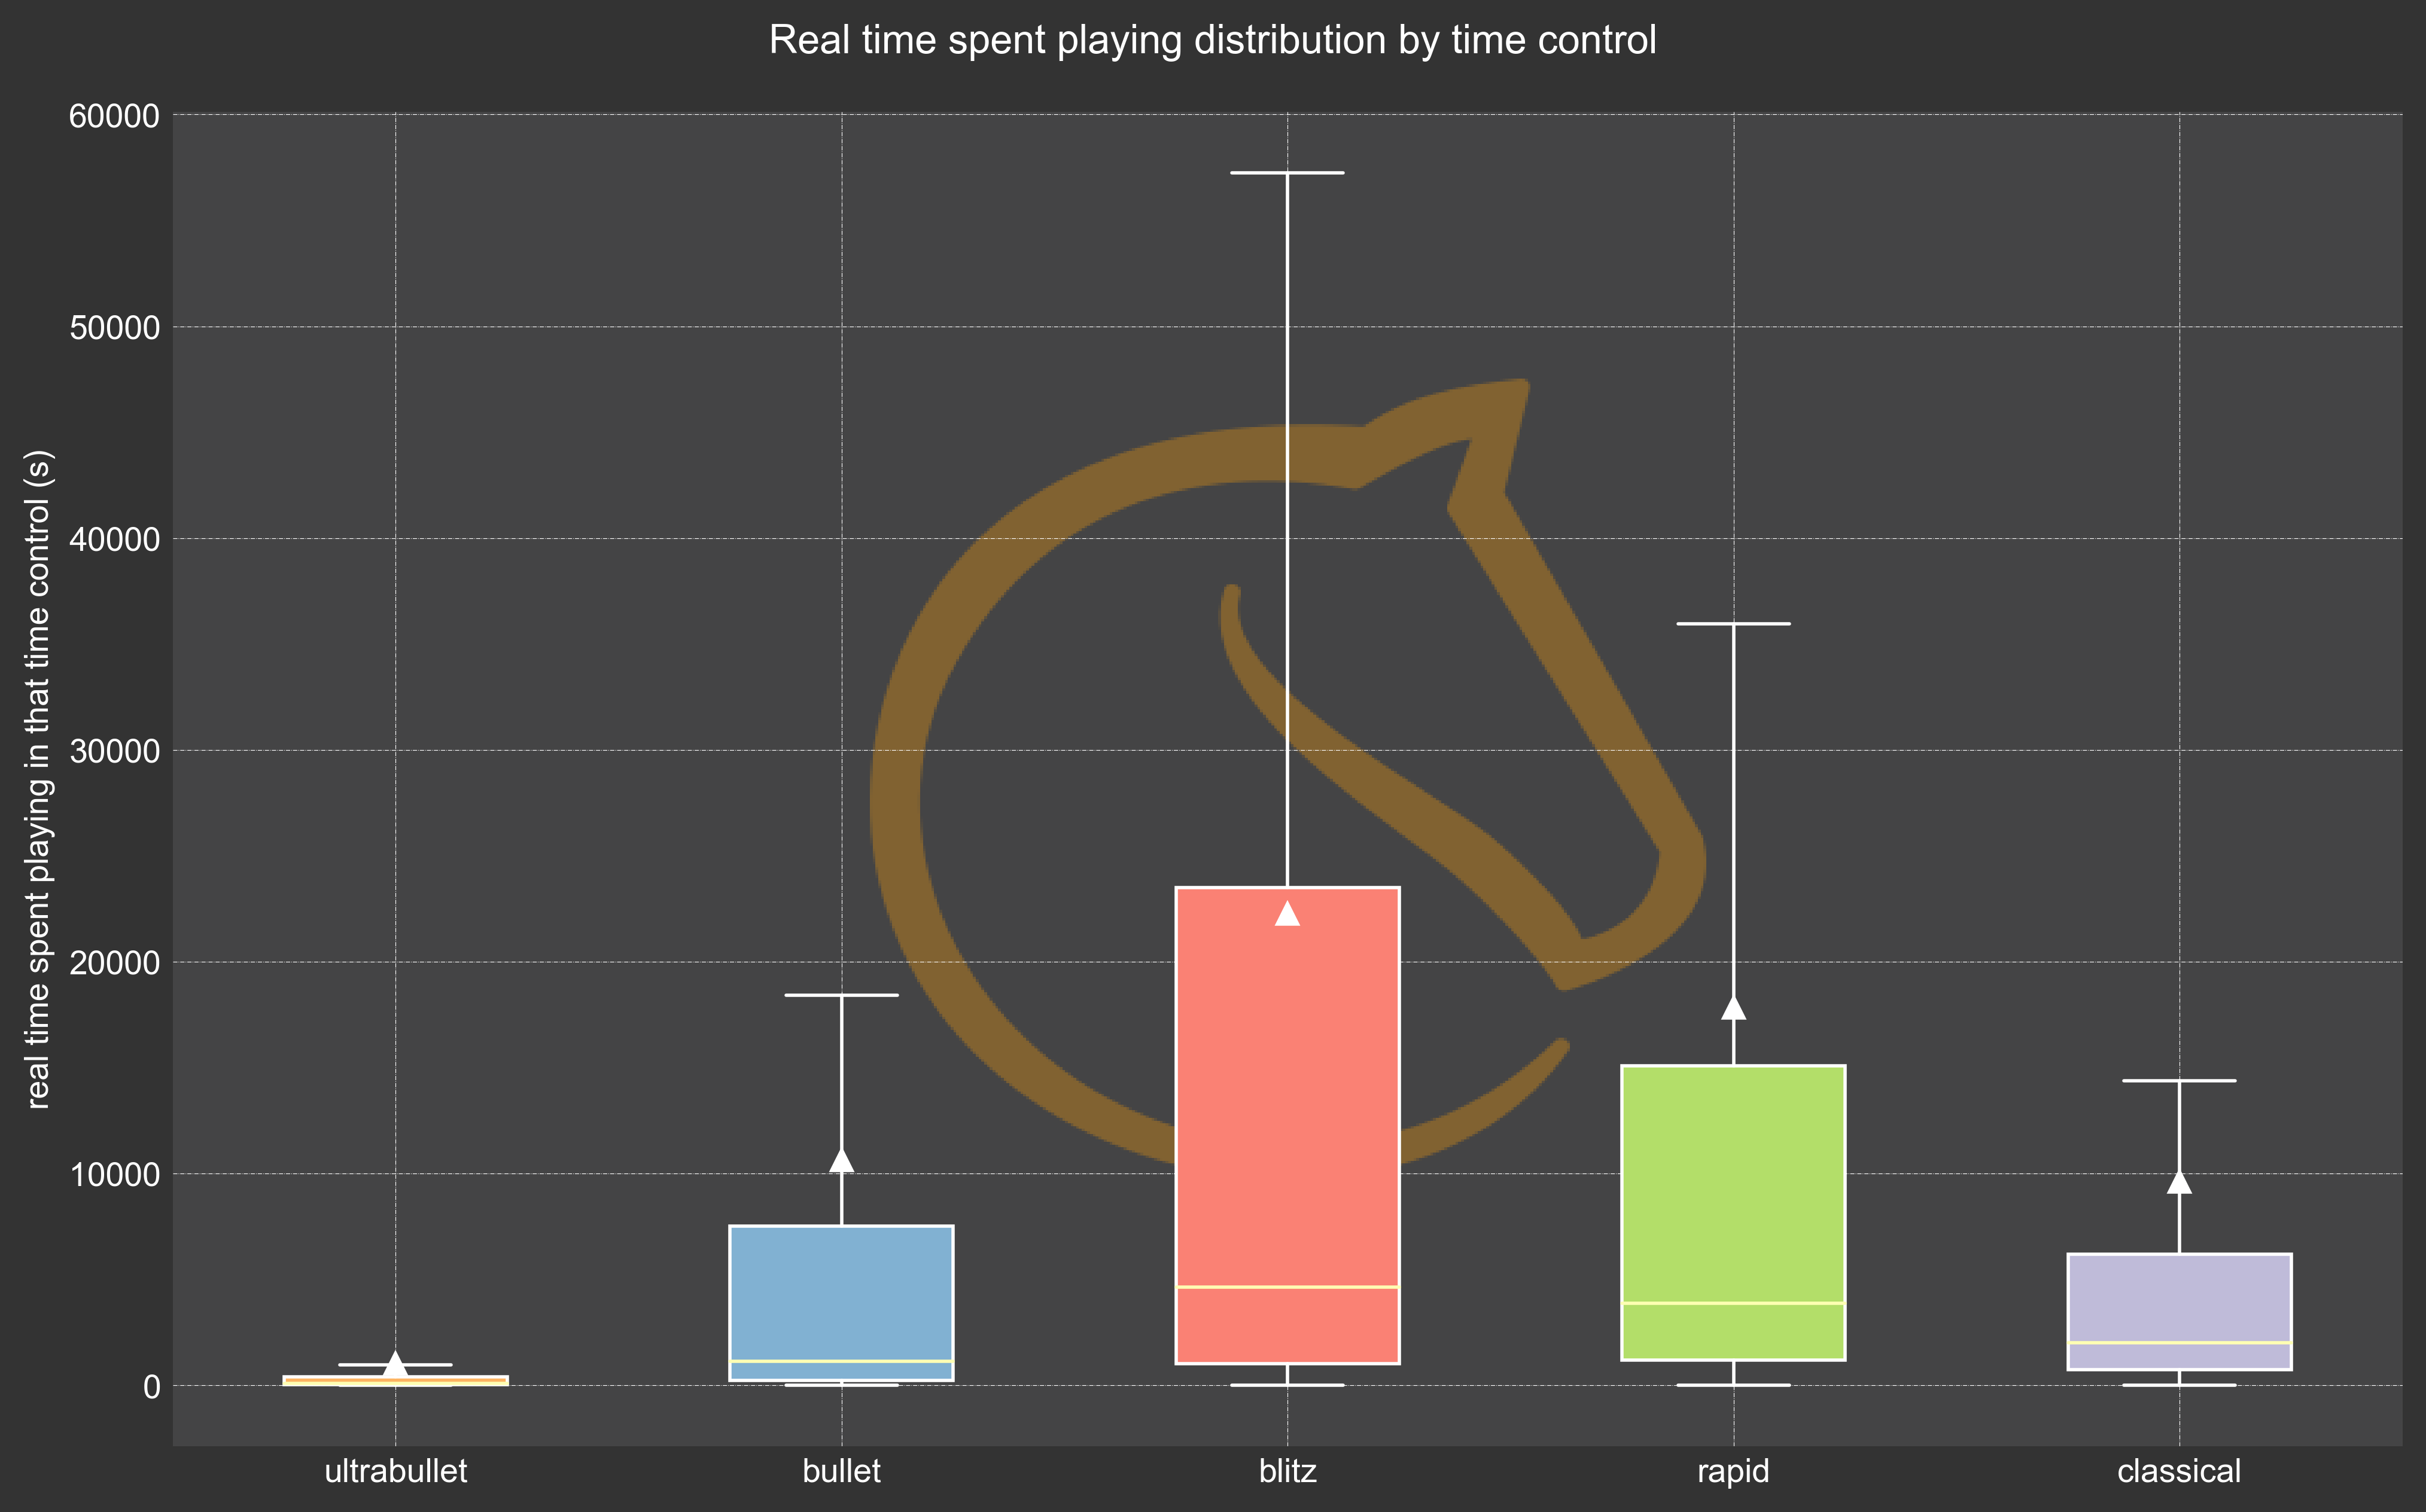
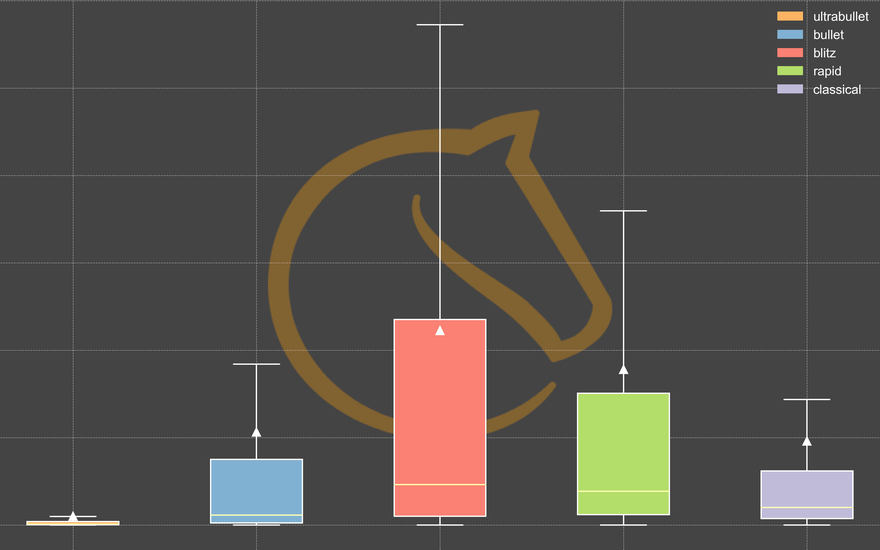
Figure 2: For each time control only players with at least one game in that TC were included. Whiskers display 1.5x IQR, outliers are hidden.
The graph demonstrates that the significant popularity of blitz is not only due to the fact that there are more players compared to bullet or rapid, but also because, on average (shown by the triangle in the figure) and median, blitz players spend more time playing it than other players play in other time controls. Another point to consider regarding the average time spent playing is that it frequently exceeds the 75th percentile, indicating the presence of significant outliers (extremely active players in our case).
Are active players versatile or specialised?
Figure 1 tells the number of players by time control, but provide no information on the overlap between these player pools. Let first see if players play multiple time controls at all. To that end, we will plot the proportion of players playing TC A out of the players playing TC B.

Figure 3: Players of a time control are defined as all players that have played at least one game in that specific TC.
For example, let's consider the bottom-left square which represents 7.4% of players who have participated in at least one classical game and also played at least an ultrabullet game.
The matrix is not symmetrical along its diagonal because it does not compare to the same player pool. In this case, the 7.4% figure is calculated among all classical players, while its symmetrical counterpart in the top-right corner (25.9% classical players) refers to all ultrabullet players, who are fewer in number (see Figure 1).
Overall, there is a relatively low intersection between time controls, with only half of rapid players also playing blitz, despite rapid and blitz being the two most popular time controls. Players playing in less popular time controls also more likely to engage in more mainstream ones, with over 80% of ultrabullet players participating in bullet, and around 70% of classical players also playing rapid.
Now, let's examine whether players who are more active in one time control tend to be more active in the others when they participate in multiple time controls. We will be using the same matrix layout, but using the Spearman's correlation coefficient, which measures the strength of the relationship between spending more time playing in time control X and playing more in the time control Y.

Figure 4: The Spearman's correlation coefficient is only calculated among the players who have played at least one game in both relevant time controls.
In order to get accurate coefficients, it was necessary to exclude players who did not participate in both relevant time controls.
Otherwise, the coefficients would have been heavily skewed twoards zero due to the substantial number of such players (Figure 3).
In general, it seems that players tend to focus on one specific time control. The correlation between ultrabullet and bullet is by far the strongest, followed by rapid and classical. This is quite logical as those time controls are very similar. The correlation between other time controls is significantly lower, and the more different the TCs are the lower it is.
How is the time spent playing distributed among the players?
Up to now we have been comparing time controls between each other. It's interesting to consider how in a specific TC our data is distributed among players. We will plot games, average rating, and time spent.

Figure 5
The number of players decreases exponentially as the number of games and time played increases, while the rating distribution follows the expected normal distribution. A surprising finding is the significant presence of new players (indicated by the large spike at 1500 rating), in contrast to the online rating distribution, which only takes into account players with a stable rating.
Let's see whether this exponential decrease is is also observed in the other time controls, using with a logarithmic y-axis which will be more appropriate.

Figure 6
While this overview clearly demonstrates that they all follow the same distribution pattern, the lack of a common scale makes it difficult to compare them. To address this issue, we will plot the number of games and time spent distribution on a logarithmic scale graph.

Figure 7
This loglog graph confirms the exponential decrease of players per number of games played.
Additionally, there is a noticeable spike in real time played for all but ultrabullet time controls, which roughly corresponds to to the expected duration of one game in that specific category. For slower time controls, the spike in game duration is smoother, indicating a greater variety in absolute game duration.
For (ultra)bullet, blitz, and rapid, a longer time control result in a longer game duration. However, this pattern does not hold true for classical time control. We can suppose that either players play faster than they should in classical games, or that classical games last fewer moves on average since it is harder to recover from a losing position.
Part two will conclude the analysis by quantifying inequalities in the spent playing distribution, evaluating the accuracy of the estimated time spent formula, determining if better players tend to play more games, and a ranking of the most active players for that month.
Update 28/11/2023: Part two is now published.
Code is open-source. Thanks to @somethingpretentious and @glbert for their extensive feedback and expertise.