extract from Figure 8
Exploring how Lichess' players spend their playing time, Part 2 of 2
Continuing analysing how players typically spend their time on Lichess.In Part 1, I broached about the dataset source and methodology, provided general statistics on the most popular time controls, examined the versatility of active players versus specialisation, and began analysing the distribution of playing time among the player base.
As shown in Figure 7, the distribution of games and time spent playing is highly skewed among players, but let's put some numbers to it using a Lorenz curve graph. This graph is a reliable way of illustrating the inequality in the distribution. It enables us to determine the cumulative percentage of total time spent playing by the top X% of the most active players.
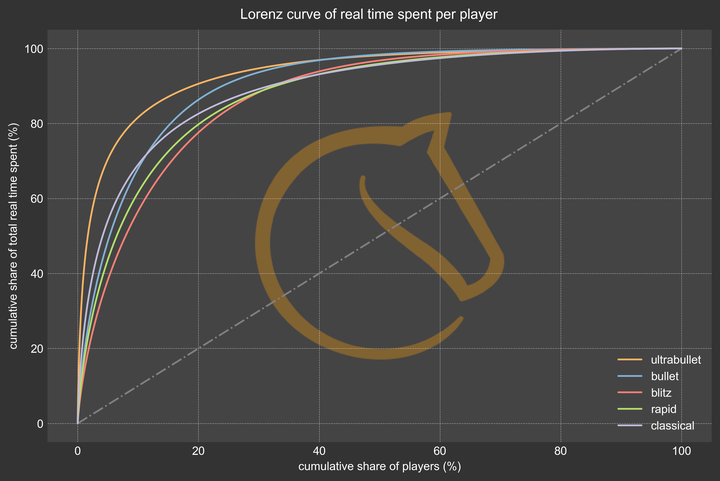
Figure 8
The Pareto principle, which states that in many cases "roughly 80% of consequences come from 20% of causes" is respected.
In fact it is even more pronounced in the ultrabullet category, where only about 10% of the players account for 80% of the time played in that time control. We can observe that the more popular a time control is, the more evenly the time played is distributed among players.
Classical chess stands out in this regard, with the top 15% most active players being highly committed, followed by a sharp drop-off of the curve, meaning the time is more evenly spread out between players after that point. This could be explained by the fact that the time commitment required to start a classical game filters out the most casual players compared to bullet or blitz, only leaving the moderately active players. This trend is also shown in Figure 2 where the range between the 25th and 75th percentile of time played is narrower compared to other time controls.
How accurate is the estimated game duration formula?
Now, let's delve deeper into the estimated game duration formula used by Lichess. As briefly mentioned in Figure 1, the formula is generally reliable except for classical time control. However, for a more detailed analysis, we will examine a boxplot of the absolute relative error. It is defined by |approximate time - real time|/real time. By visualizing the spread of errors across different games per time control, we can gain a more nuanced understanding of the formula's accuracy.
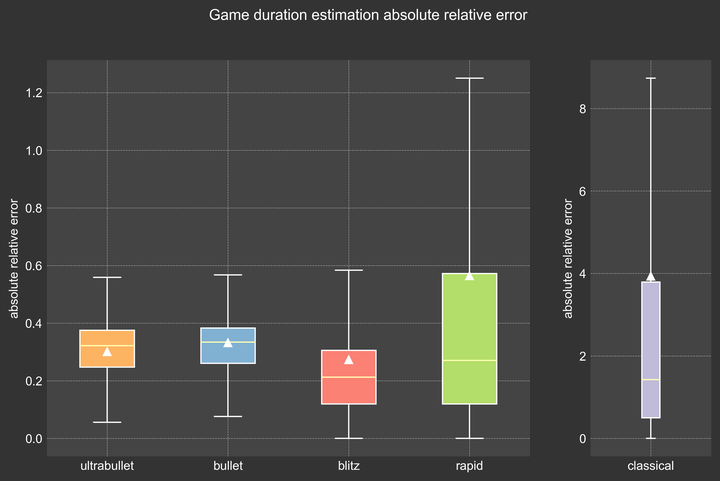
Figure 9: Lower is better. Whiskers display 1.5x IQR, outliers are hidden.
As we can see the formula is fairly accurate for short time controls, with an absolute game duration error of ~30% on average up to the rapid category, but its accuracy decreases for longer TCs, to the point that a separate scale was required for classical.
Now, to determine whether the formula overestimates or underestimates the duration of the game, we need to analyze the distribution of non-absolute relative errors.
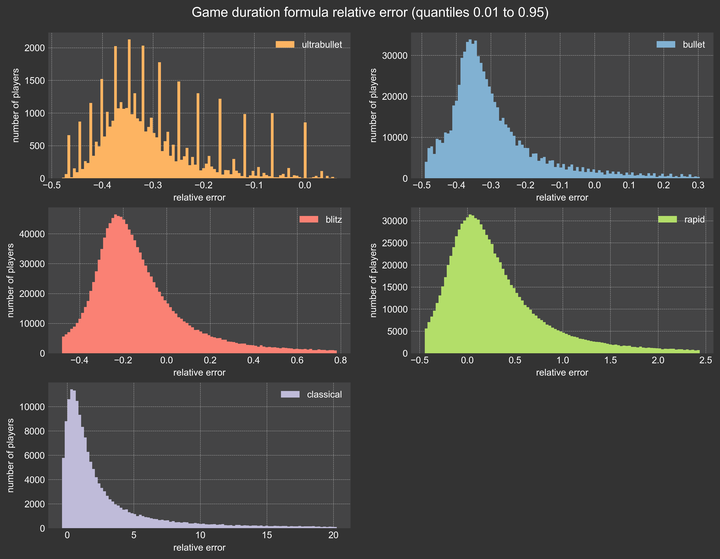
Figure 10: A negative relative error means the estimated duration was shorter than the real duration of the game, a positive error the opposite.
The formula tends to underestimate the game duration in short time controls, then starts overestimating it. I am not sure what phenomon create these spikes in the ultrabullet distribution, but it is probably due to the limited accuracy of measuring game duration (down to the second).
Do better players play more?
Although correlation does not imply causation, it is intriguing to investigate whether more skilled players tend to spend more time playing than the average players. A scatter plot of the amount of time spent playing against player ratings is a good first approach to detect patterns or trends.
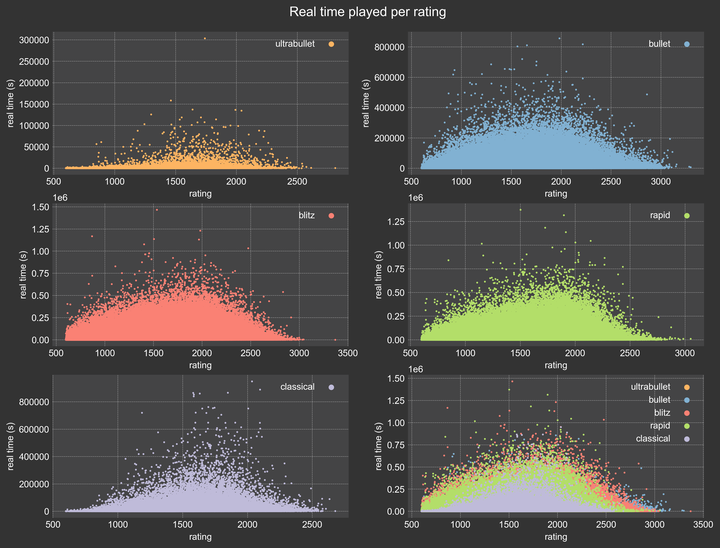
Figure 11
There seems to be a slight tendency for players above 1500 to play more, we can confirm that by checking the rating distribution weighted by time played, and comparing it to the unweighted one.
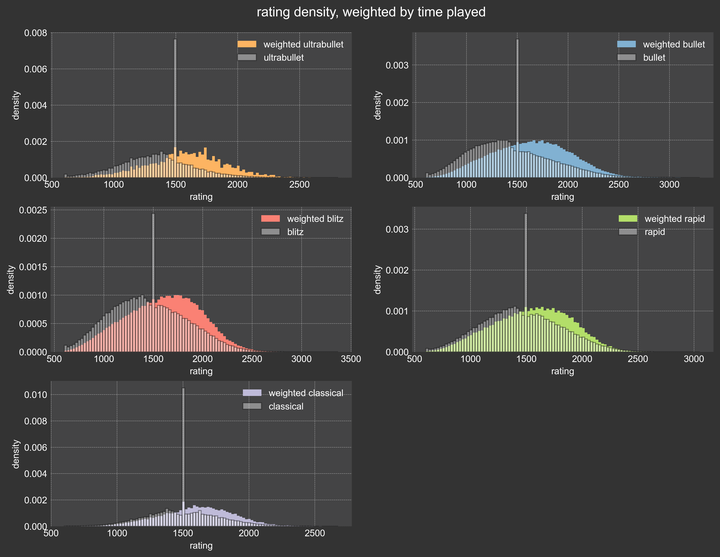
Figure 12
Proportionally weighting by time played has the consequence of erasing the new players spike at 1500 in all but classical time controls, as well as shifting the bell curve to the right (compared to the unweighted version), confirming that better players (as in players above the median) play more games.
Conclusion
If you feel trapped in an unstoppable blitz frenzy, you are not alone! Here is a top 20 of the most active players on Lichess that month (January 2023).
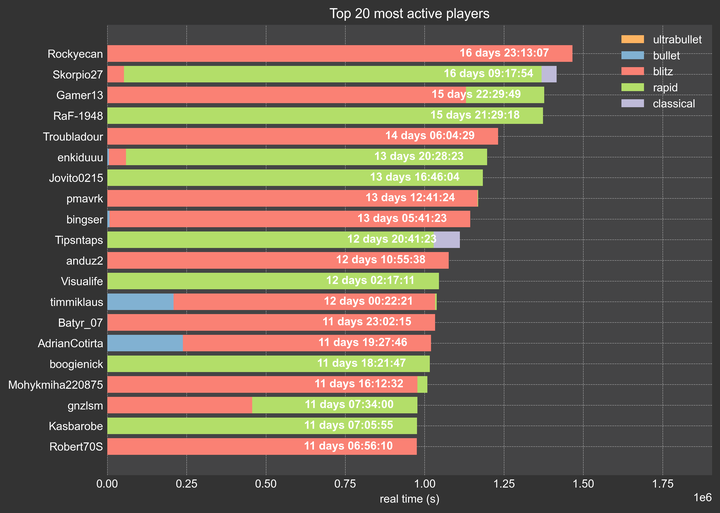
Figure 13
Code is open-source. Thanks to @somethingpretentious and @glbert for their extensive feedback and expertise.